 +1-530-388-5507
 +91 91633 67905


Why Arobit Supports Verified .IN Domains: Building Trust in India�s Digital Space
Knowledge Base
A
Amit De
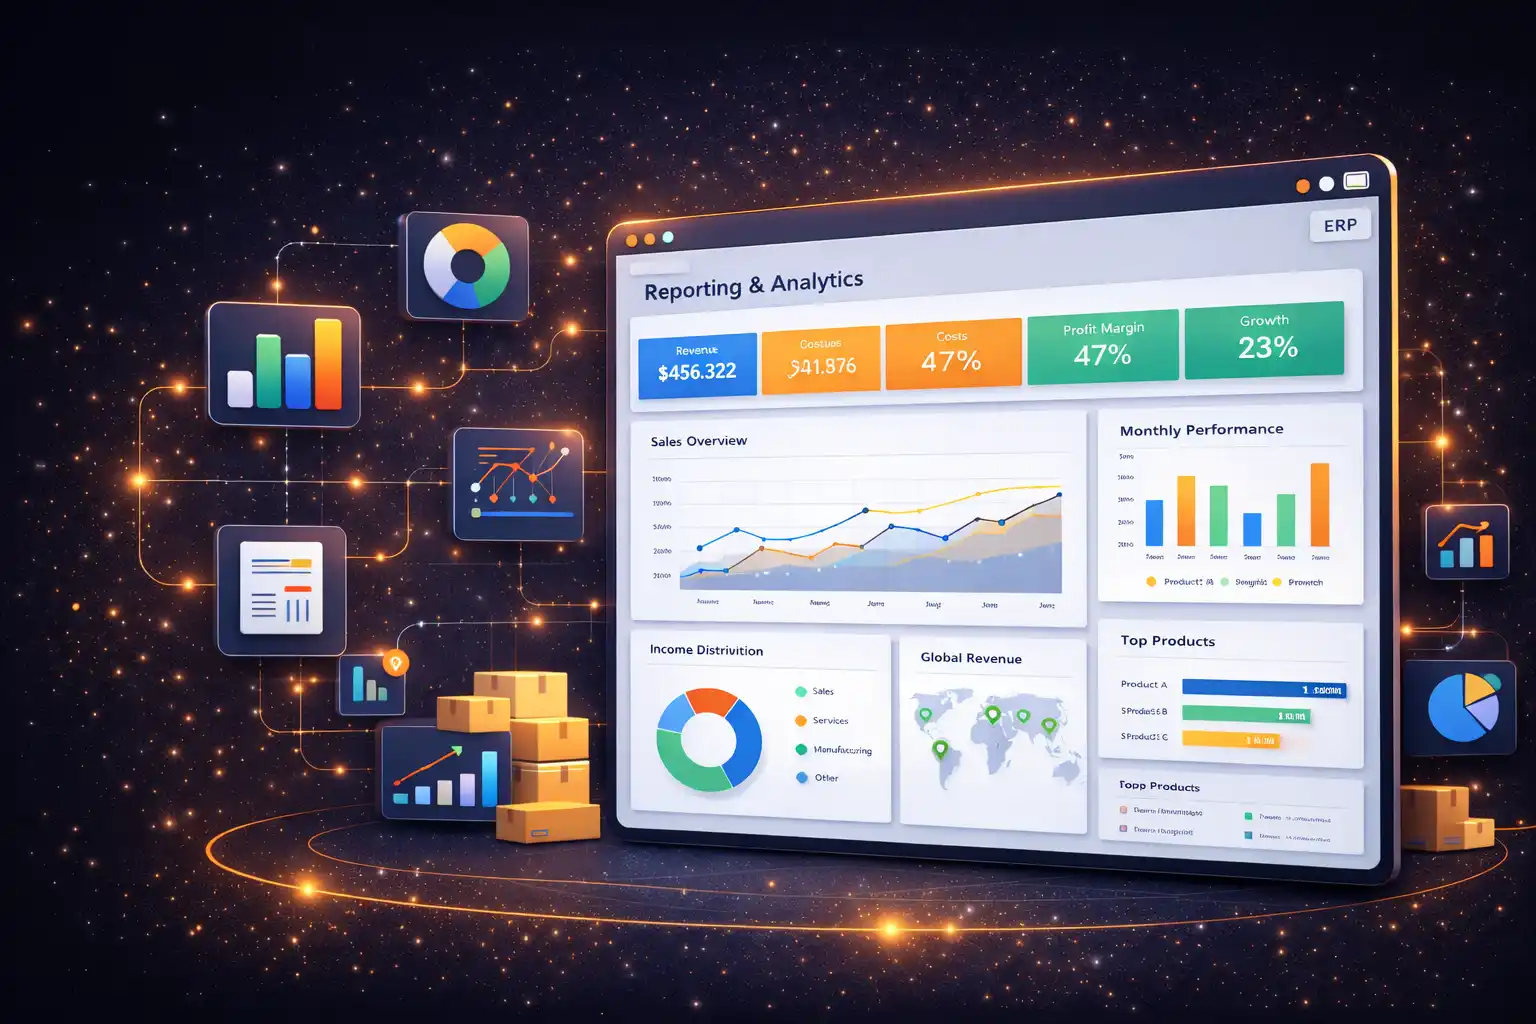
A reporting module in ERP turns data from every department into dashboards, reports and alerts. Arobit builds it around your KPIs, not a generic template. Managers then act on live numbers instead of waiting for month-end files.
Reports built by hand are late, inconsistent and hard to trust. These are the five gaps we see most often.
Finance, sales and operations each keep their own file. Totals disagree and meetings turn into debates. Nobody trusts the figure on the screen.
Analysts export data and rebuild the same sheet every week. Each report is already out of date when it is sent. Skilled people spend days on formatting.
Stockouts, overdue payments and margin leaks surface in the month-end review. By then the damage is done. Teams react instead of prevent.
A total looks wrong but nobody can trace why. Teams search through files and inboxes for the cause.
Spreadsheets travel by email with every column visible. Access cannot be controlled or audited. One forwarded file can expose pricing or payroll.
The module reads live data from finance, sales, inventory, production and HR. It organizes that data into standard and custom reports. Users filter, drill down and export without help from IT. Every number traces back to a posted transaction.
An analytics module in ERP goes one step further. It spots trends, compares periods and flags exceptions before managers ask. Reports describe what happened. Analytics shows what is changing and why.
Data and analytics leaders were three times more likely to say analytics added 20 percent or more to EBIT.
McKinsey
That advantage starts with trusted data. One reporting layer removes version conflicts between teams. Decisions then rest on a single set of numbers.
Speed matters as much as accuracy. When a report refreshes as transactions post, managers see a problem the same day. Corrective action costs far less than it does after the month closes.
Every report and dashboard is built around your KPIs. The ERP reporting module covers data capture through board-level summaries.
Track sales, stock, cash and production on one screen. Figures refresh as transactions post.
Start with ready reports for finance, sales, inventory and HR. Adjust columns and filters to your needs.
Build reports by choosing fields, filters and groupings. Save them for your team to reuse.
Set targets by team, product or branch. See actual against plan with clear status colors.
Click any total to open the invoices behind it. Trace an exception to its source in seconds.
Email or share reports on a schedule you set. Alerts fire when a metric crosses a threshold.
Control who sees which report, branch or column. Every view and export is logged.
Export to Excel, PDF or CSV. Connect external BI tools through standard APIs when needed.
Book a short walkthrough using a sample of your own data. We will show how your top KPIs would look on screen.
Request a Demo| Area | ERP Module | Standalone BI Tools |
|---|---|---|
| Data | Reads live data from every module directly | Needs pipelines to copy data out of the ERP |
| Accuracy | Totals match the books because both share one source | Copies can drift from the ERP between refreshes |
| Cost | One platform to license, host and support | Extra licenses plus integration spend |
| Fit | Shaped around your KPIs and user roles | Generic models that need heavy setup |
Track output, scrap, downtime and cost per unit by line. Spot slow lines before targets slip. Management reviews use one shared view.
Compare sales, stock cover and sell-through by store and brand. Act on slow movers early.
Monitor order fill rate, delivery performance and stock by depot. Share live status with customers.
Report on patient flow, billing and inventory use. Keep records ready for audits.
See utilization, margin and billing by client and project. Forecast revenue from signed contracts.
Reports are only as good as the data feeding them. We connect the module to four areas of your ERP.
Ledgers, receivables and payables feed live statements from the finance and accounting module. Budgets are compared with actuals automatically.
Stock cover, turns and supplier performance come from the inventory management module and the supply chain module.
Orders, quotes and targets flow in from the sales module. Managers track pipeline and conversion in one view.
Output, scrap and delays are read from the production planning and MRP module. Supervisors see plan against actual.
Arobit built a field sales automation system for an FMCG distributor. It covers order capture, beat planning, secondary sales tracking and mobile distributor dashboards. Manual reporting overhead fell by over 60 percent. Distributors read their own numbers on mobile dashboards.
Arobit built an ERP for the cut-to-pack workflow of a garment maker. It covers 50+ sewing lines across 3 units and 25,000+ garments a day. Live line-wise visibility helped cut defect rates by 22 percent. Managers see progress by line through live dashboards.
We list the decisions your teams make and the numbers behind them. We agree report owners, refresh needs and access rules. Early clarity prevents rework later.
We configure dashboards, report layouts and drill paths to your process. You review working screens before we build further.
We develop in short sprints and connect finance, inventory, sales and production data. Historical data is migrated and checked against source records. Each sprint ends with a live demo.
We train report owners, go live in phases and monitor usage. Our team keeps adding reports as your questions change.
It is the ERP component that turns transaction data into reports, dashboards and alerts. It reads live from finance, sales, inventory and production.
Exports are static and age quickly. The module stays live, controls access and traces each number to its source. Teams stop rebuilding the same sheet every week.
It adds trend analysis, period comparison and exception alerts. Managers see what is changing, not just what happened. Forecasting can be layered on when you need it.
Yes. Trained users pick fields, filters and groupings to build reports. IT steps in only for new data sources.
For most mid-sized firms, yes. One source avoids sync errors and lowers integration cost. Very large firms may still add a dedicated BI platform.
Access is role-based by report, branch and column. Every view and export is logged for audit.
We typically deliver a first version within 3 to 5 months. Scope, integrations and data quality decide the final timeline.
Yes. We integrate with accounting packages, CRM and BI tools through standard APIs. Data syncs automatically, so nothing is retyped.
We review your current reports, rebuild the useful ones and import past data. You verify totals before go-live. Duplicate or unused reports are retired.
Check how it handles drill-down, access control and custom reports. Ask for a demo using your own data. Confirm who supports it after launch.
Share your KPIs, reports and data sources with us. We will respond within 24 hours with next steps. The first 30-minute session is free and carries no commitment.
We don't simply say that we have a top-tier clientele, we mean it. Take a look at some of the top brands, social communities, and app stores, we have worked for.





































































Stay on top of the latest trends and industry developments with our insightful blogs.